Getting Started#
System Requirements#
Chip: 4 core minimum
Processor: 2.5GHz or higher
RAM: 8 GB
Disk: 5 GB free for installation
Warning
ARM chips are not supported
Installation#
Windows#
Download the latest version from the Github repository <vTarget/vtarget-release>`_
Mac#
Note
Upcoming
Standalone#
Free Trial#
Enter the download link, and request to start your free trial of 30 days. You will be able to access all the modules with minimal restrictions that we’ll announce soon
Activate#
Access the activation section and follow these steps:
Create an account
Validate the account from your email
Choose the plan that best suits your needs
Make the payment process
Wait a moment until you receive a token and copy it to the clipboard
Open vTarget and paste the text in the popup that asks for the activation key
Click accept and wait a moment for activation
Upgrade#
When there is a new version, you’ll receive an alert when you open vtarget, you just have to accept the update and it will be installed automatically.
Quickstart#
This guide is an overview and explains important features; more details in Modules.
Home#
It is the welcome screen after logging in, the first time you enter it will have these elements.
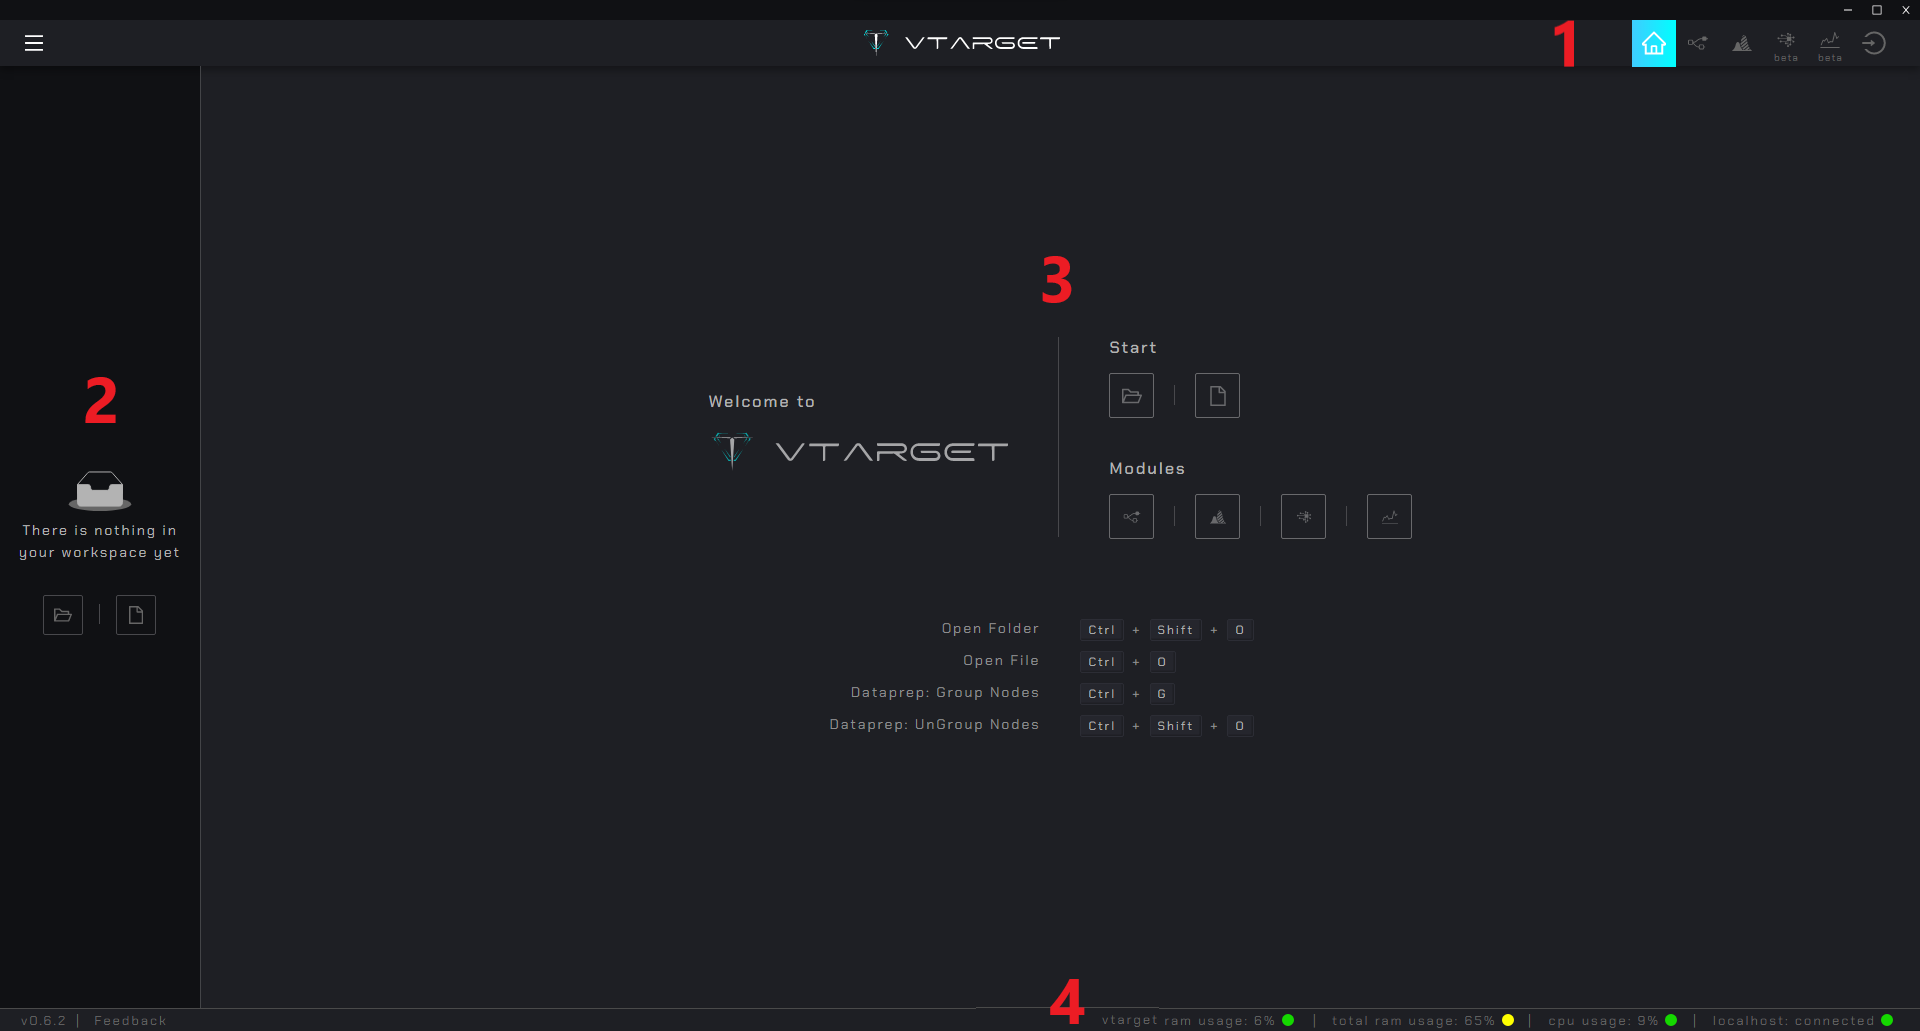
Navbar: Navigation between
Homeand the 4 modulesDataPrep,DataViz,AutoMLandAutoTSL-Sidebar: Directory navigation panel
Content: Main area, in the
Homecontains access to modules and shortcutsFooter: Provides information on processor performance and connection status with workers
DataPrep#
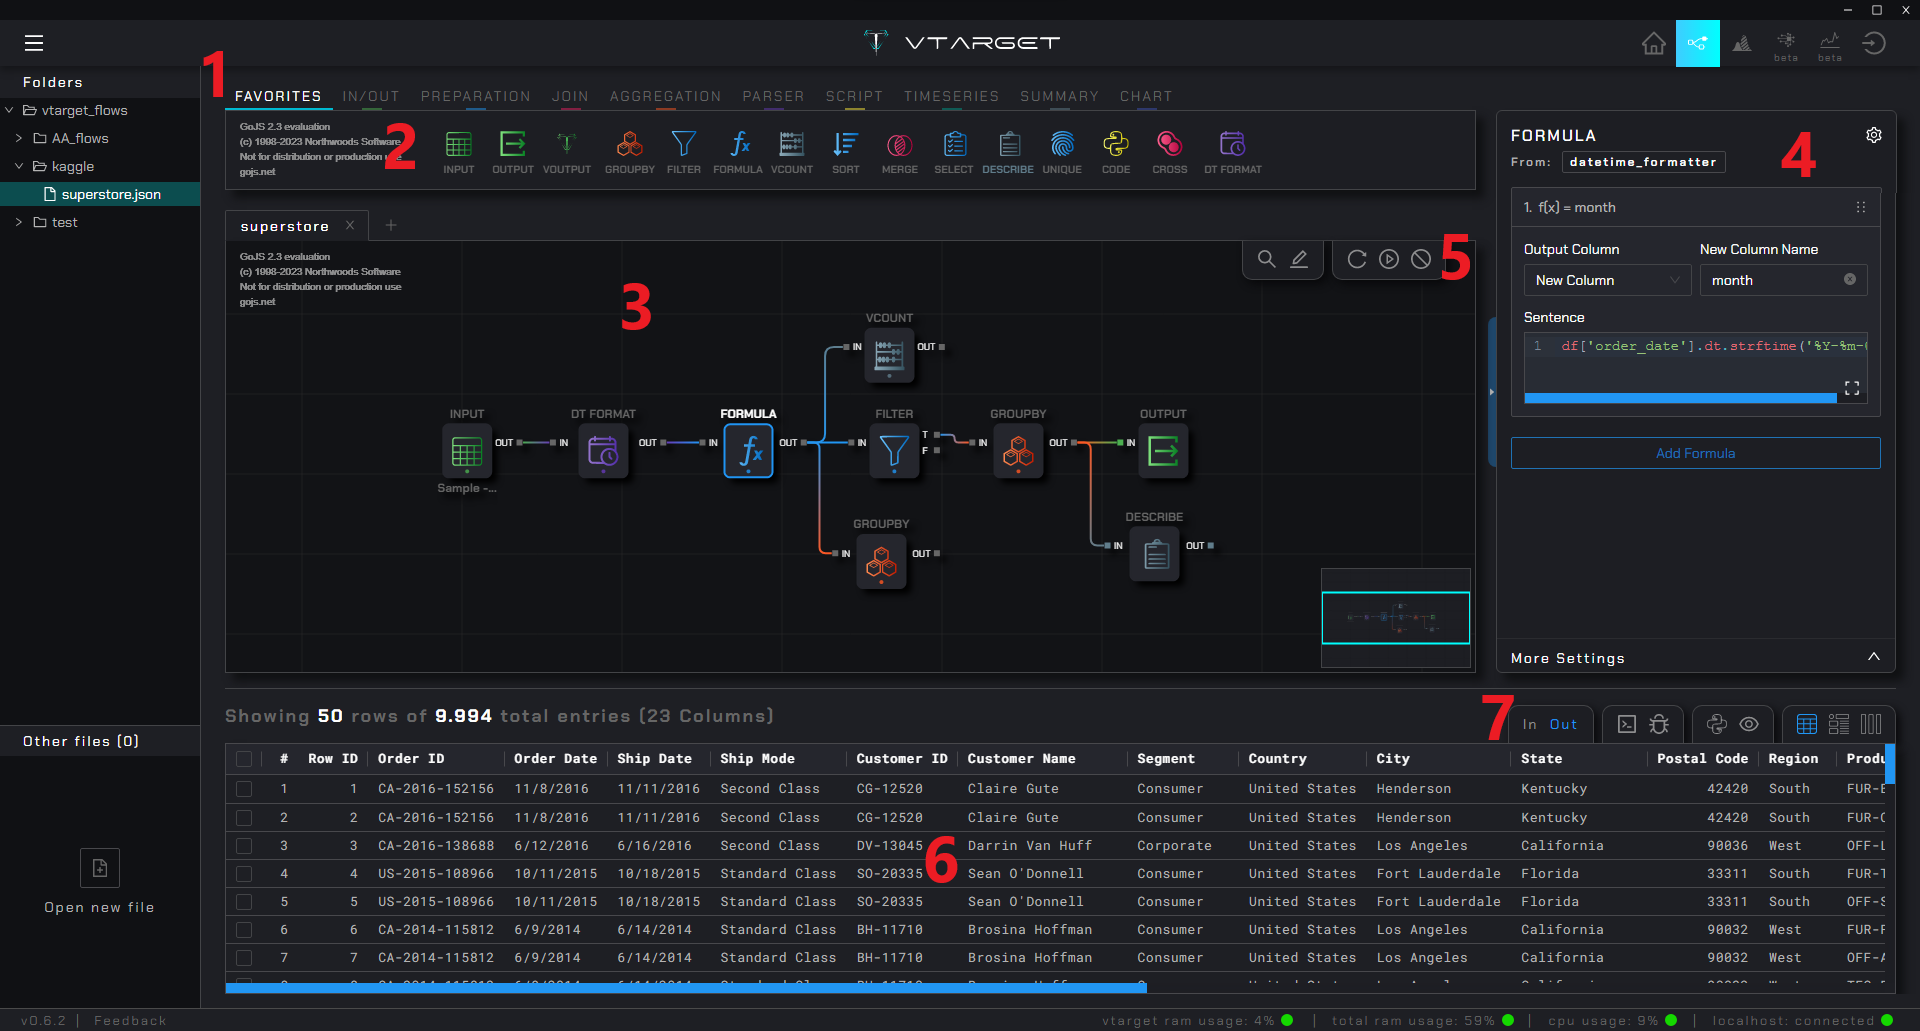
Node group: Menu to select the required node group
Palette: Area where all the nodes of a group are shown, you can drag them onto the canvas to connect with other nodes
Canvas: Area where you drop a node, and connect with others to create a flow. You can move freely and you have no space limits, you can give the shape you want
R-sidebar setting: Panel to configure a node. Only displayed when a node has focus (keeps the
Pandasstandard)Execution controls: Group of buttons for executing flows and another group for searching for nodes and writing comments on the canvas
Result zone: Shows information associated with the result of each node, it changes depending on the option selected in the upper left corner
Result controls: Controls the output you want to see from the selected node: input and output ports, log console, debugging, auto-generated python code and 3 types of table display (compact , detailed and by column)
DataViz#

Plot group: Menu that groups graphs according to the type of variable they support
Plots: List of available plots belonging to the selected group
Data-sources panel: List of loaded data sources and their variables that can be dragged into the chart setup
Setting panel: Settings panel for each graph (changes take effect in real time)
Plot view: Plot view with the given settings
Data source view: Table associated with the selected data source
AutoML#
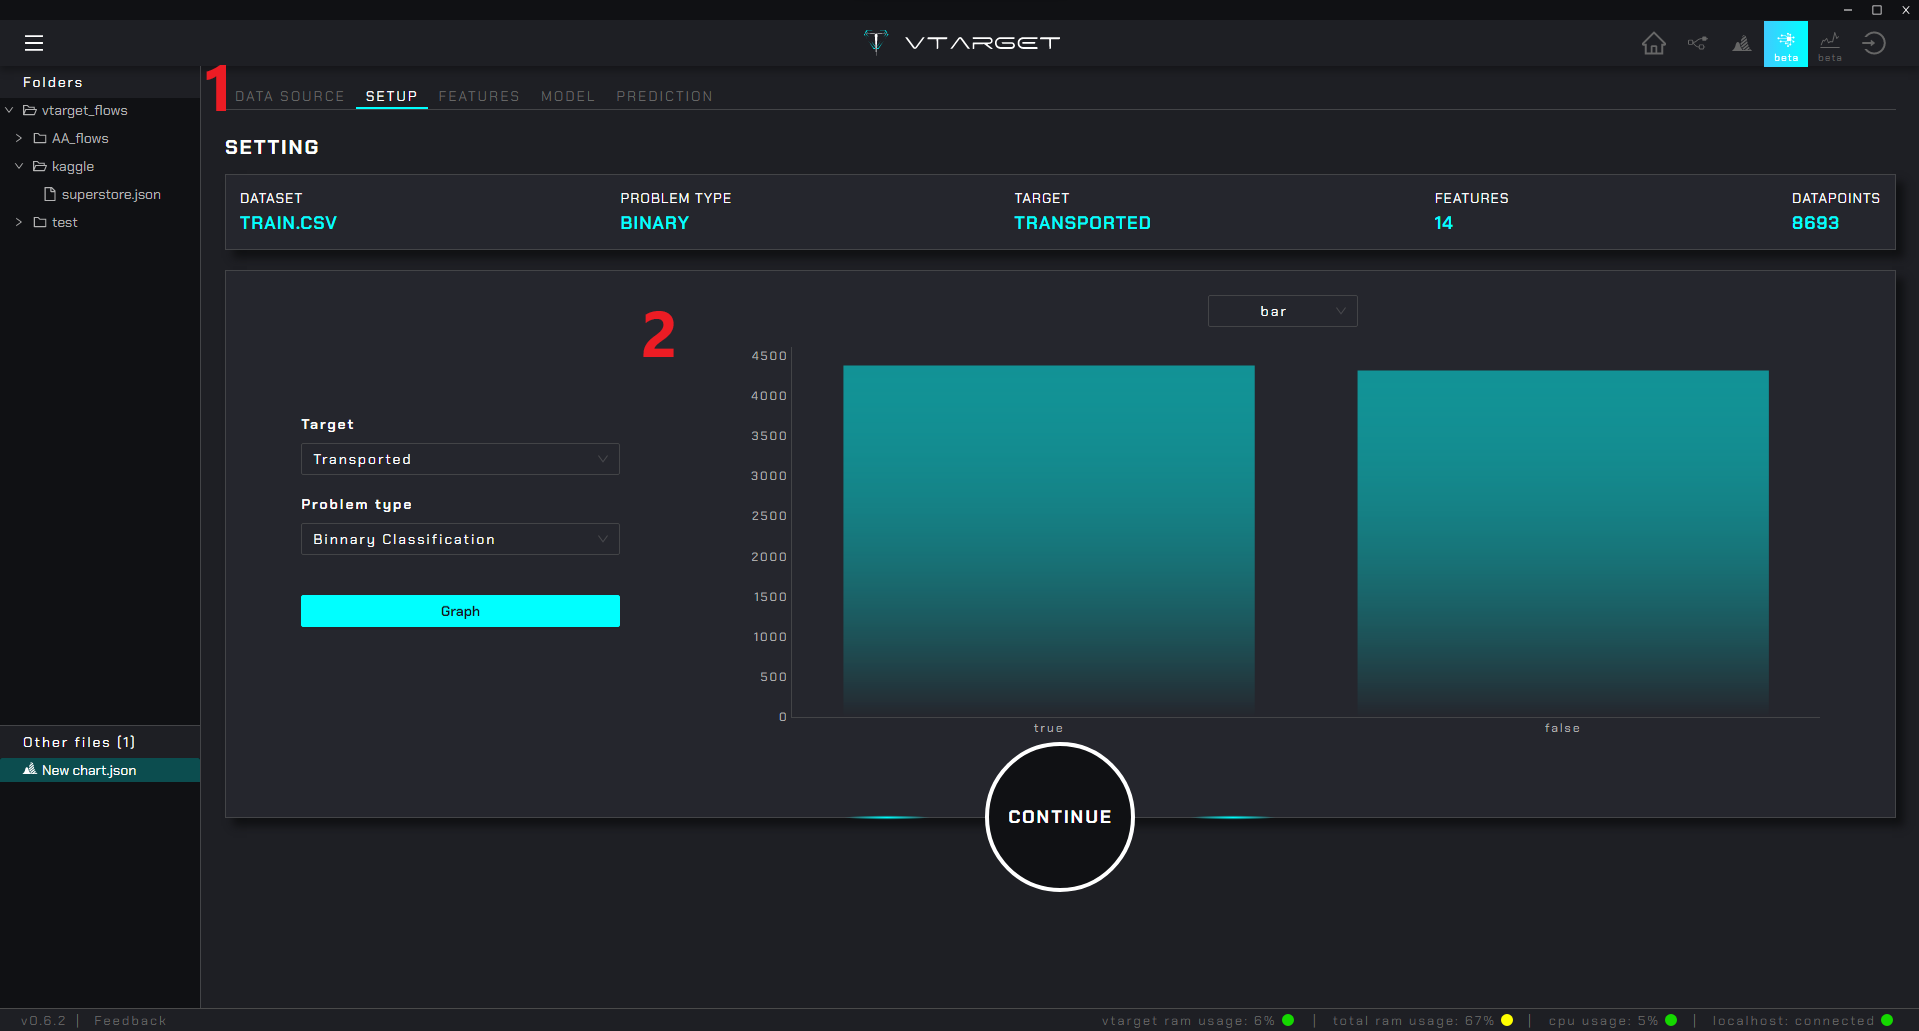
Step Menu: Contains the steps to configure the modeling of binary, multiclass and regressors problems
Content zone: Shows the settings and options associated with the selected menu
Note
The reference image shows the configuration of a binary model, however for multiclasses and regressors the process is the same:
DATA SOURCE: Select the source either from a
voutputnode (from thedataprepmodule) or from an external csv fileSETUP: Choose the
target variableand automatically infer theproblem type(you can change it in case of error)FEATURES Configure partitioning, choose the
target metricand select which variables to use in training (a descriptive analysis of each variable is also automatically generated)MODEL: Automatically performs the training process by iterating different
models,pipelinesandhyper-parameters. Lets you examine each model and view performance metrics. As they are trained they are ordered by the best target metricPREDICTION: Generates predictions with the
recommended model
AutoTS#
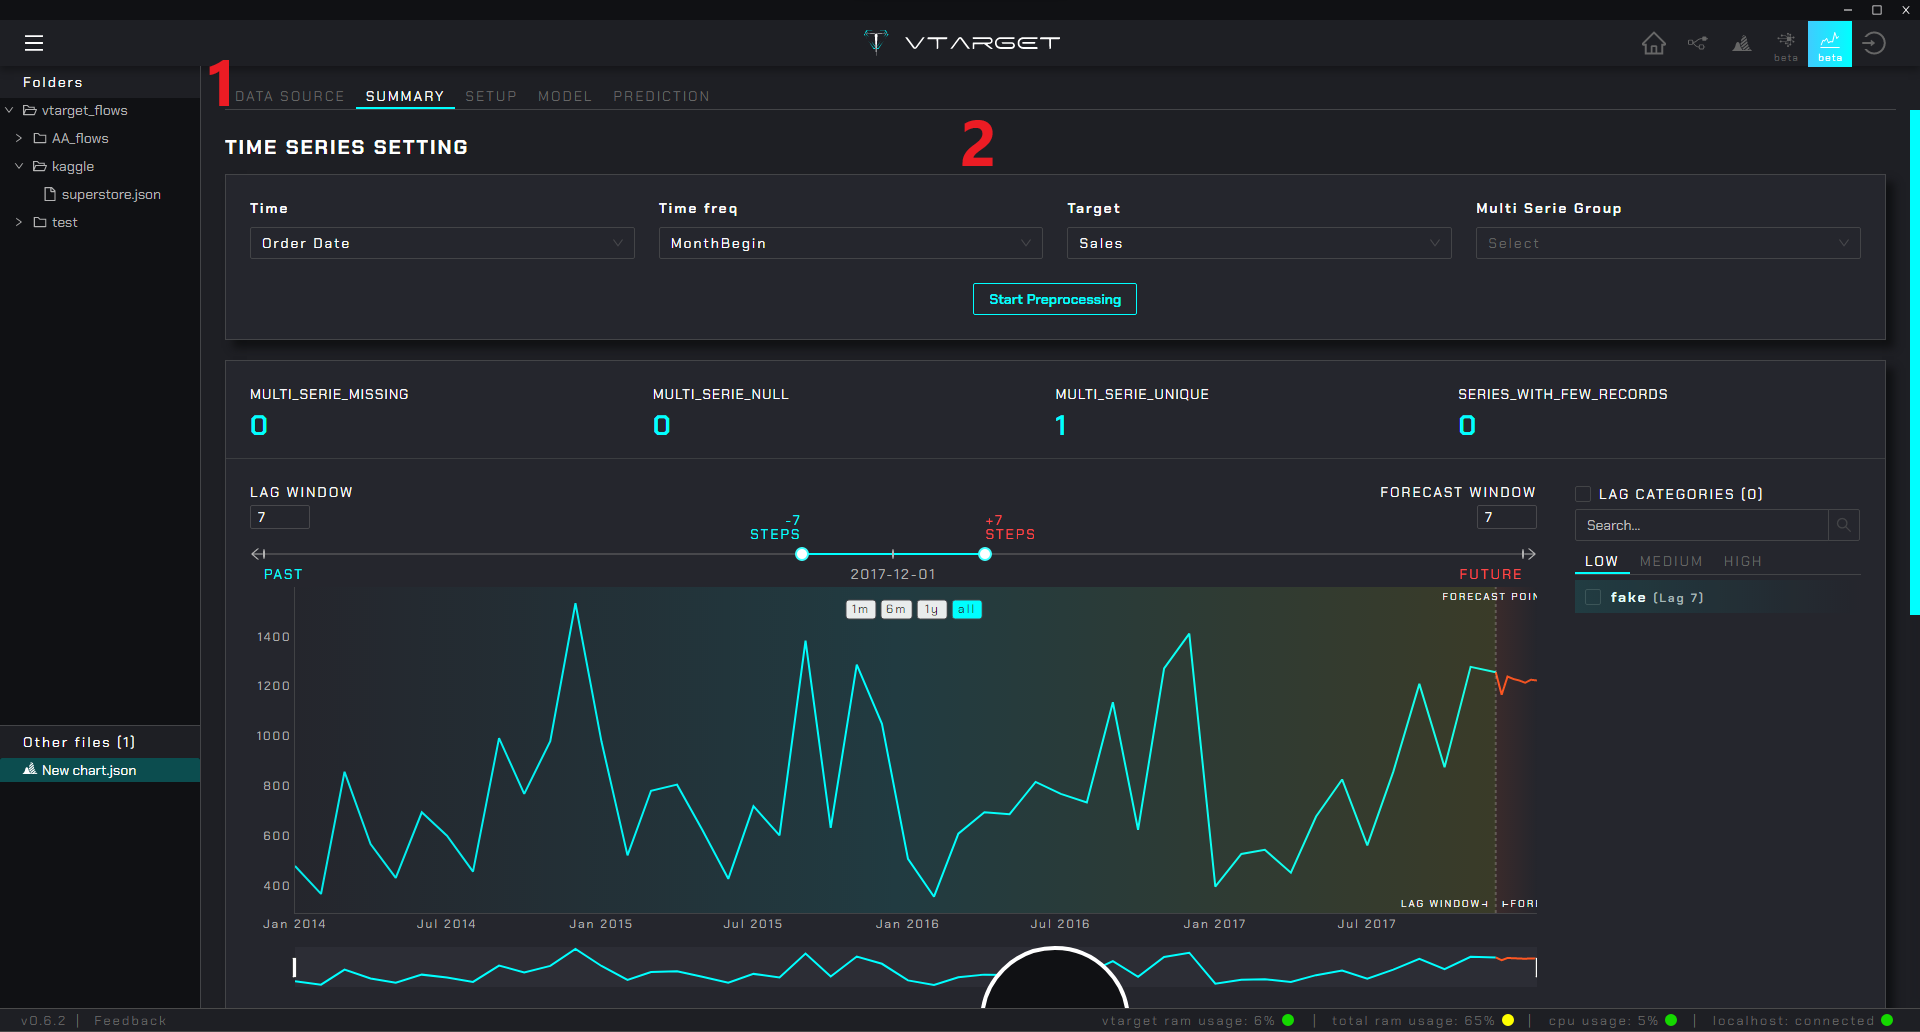
Step Menu: Contains the steps to configure the time series modeling
Content zone: Shows the settings and options associated with the selected menu
Note
The reference image shows the summary after selecting the column associated with the time, the frequency of the series and the target. In the case of forecast the menu follows the following logic:
DATA SOURCE: Select the source either from a
voutputnode (from thedataprepmodule) or from an external csv fileSUMMARY: Generates a summary of the series, a visualization of each series is created and automatically categorized according to its
variability coefficientin LOW, MEDIUM and HIGH. A general summary of the selected series is generated at the bottom of the screen.SETUP: Configure the partitioning, choose the
target metricand select which variables you will use in the training (a statistical summary of the series is also automatically generated with the given configuration)MODEL: Automatically performs the training process by iterating different
models,pipelinesandhyper-parameters. Lets you examine each model and view performance metrics. As they train, they are ordered by the bestPREDICTION: Validates or generates predictions for a given series with the
recommended model(or any other)